Monthly NPS
Alan
2021
The following is a brief analysis of a Monthly NPS presentation. The company and slides are omitted, and the values are modified for confidentiality.
The first thing was to graph the NPS and the total number of responses over time. All the graphs were made in tableau for dashboard purposes and then send as image to a presentation.
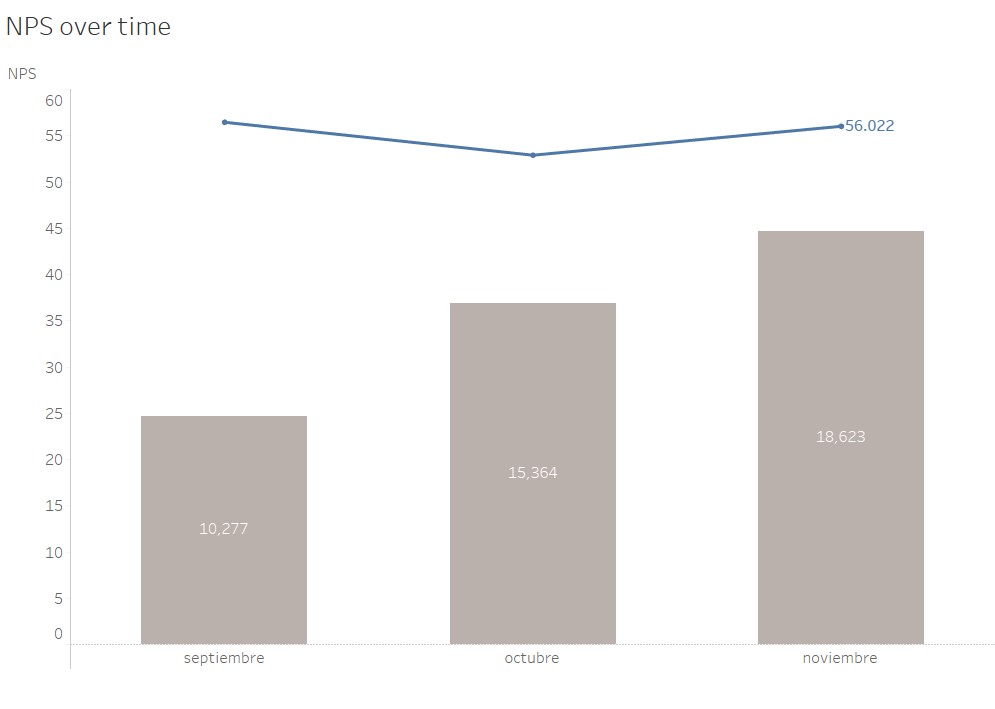
Overall NPS
We see that the NPS is largely stable, in November we recovered from the problems in October.
In total responses, we continue to increase the number of responses
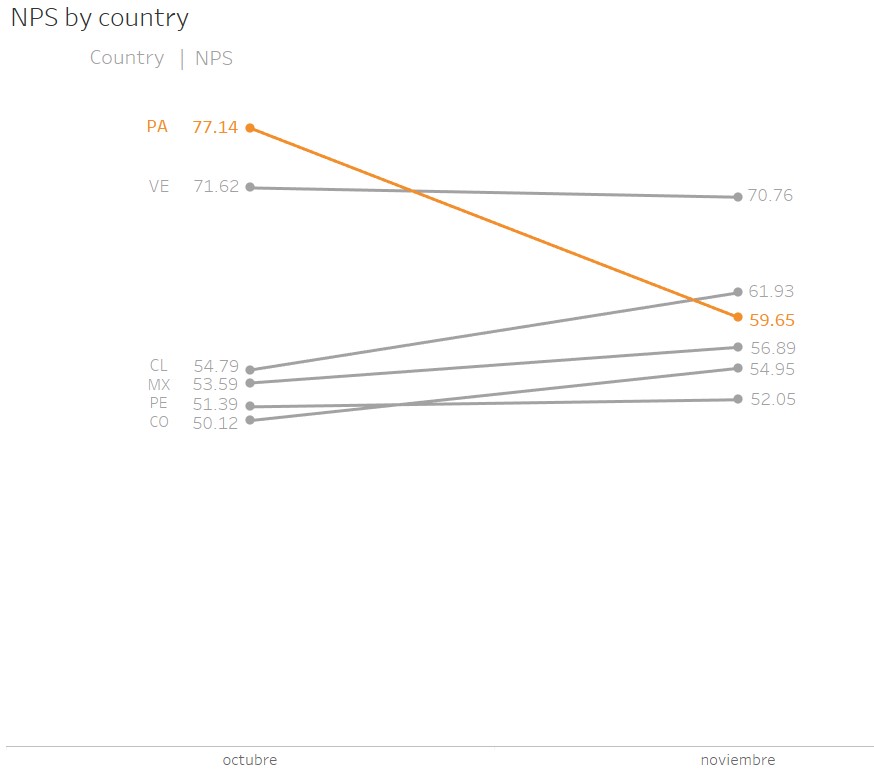
NPS by country
Overall NPS shows an improvement, however that in not the complete story. If we see the changes in NPS by country, then we see a different story.
We see 4 countries with improvements and 2 countries with decreases. The important one and the problem is PA. PA has a 22% decrease to the previous month, so we need to focus in that area.
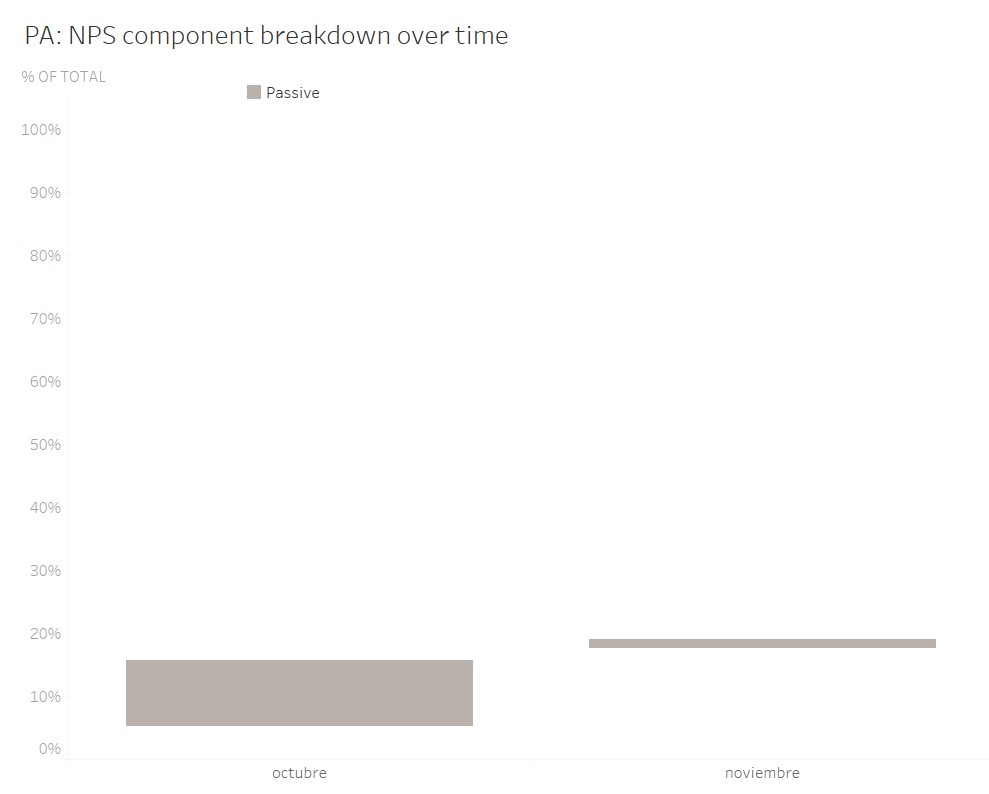
PA: NPS components breakdown – Passives decreasing.
We are going to breakdown NPS to see where the problem lies.
First, we see that the number of passives is decreasing. The percentage decrease was 86% from the previous month.
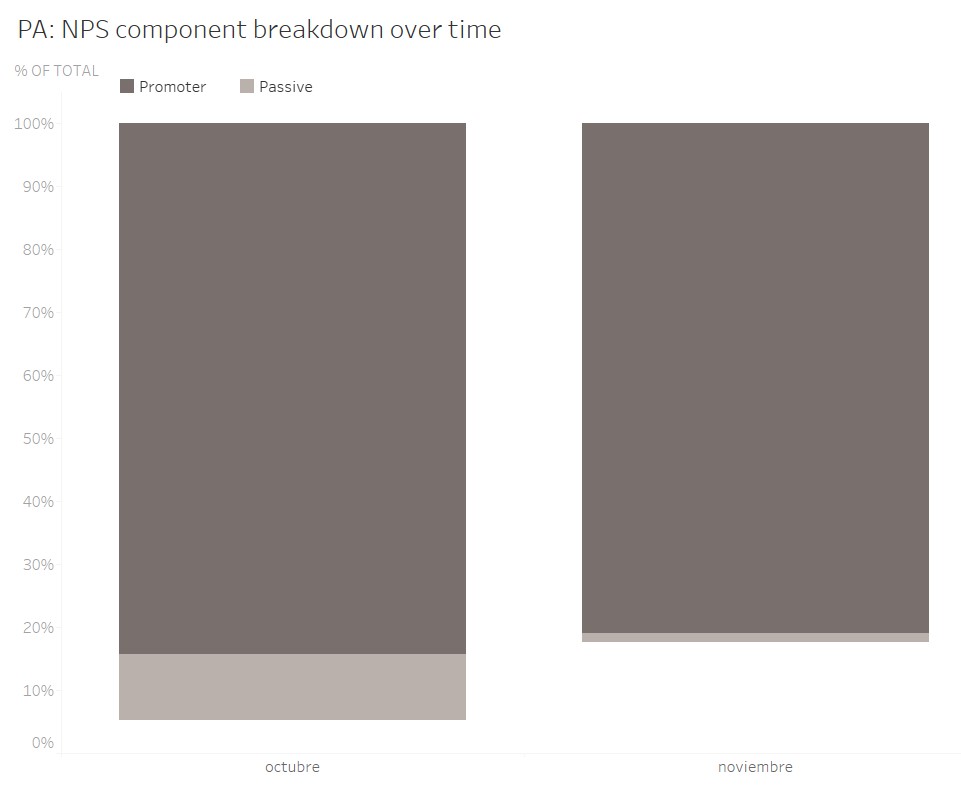
PA: NPS components breakdown – Promoters decreasing.
One problem that we found is the number of promoters decreased by 4%!
PA: NPS components breakdown – Detractors increasing.
We saw decreases in passives and promoters. Leading to a sharp increase in detractors. This is the reason why PA has a 22% decrease from the previous month.
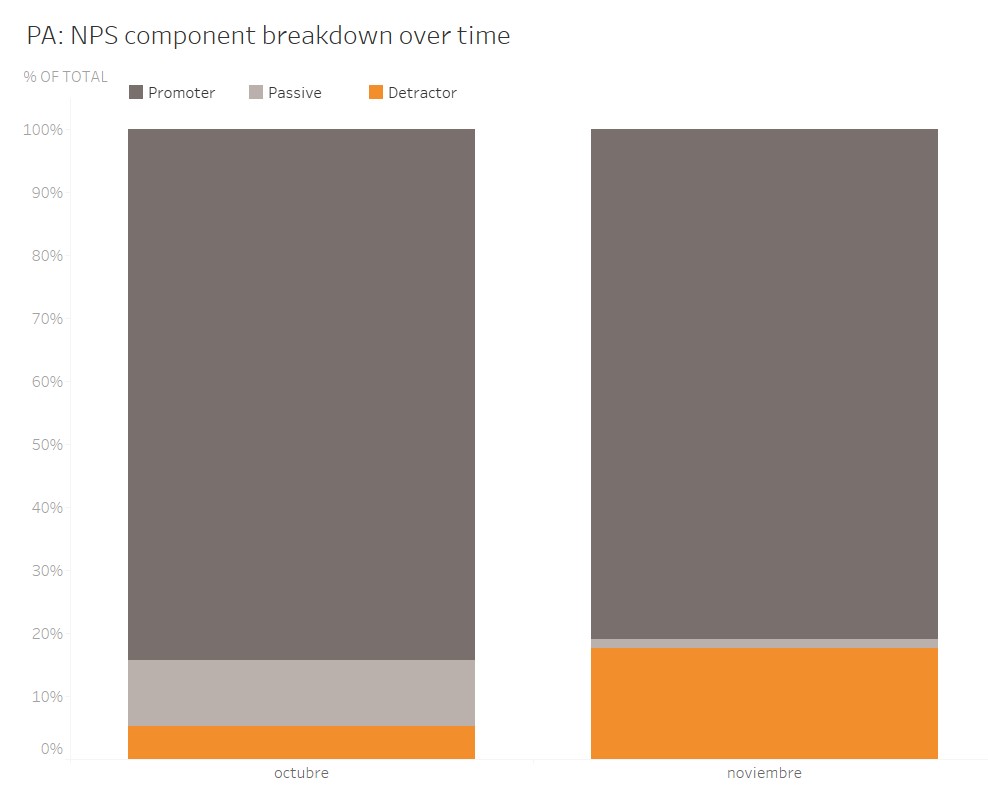
PA: NPS components breakdown – Detractors more than double
The increase of detractors from the previous month is 236%. We need to find the cause of this sharp increase.

We can find what could be the problem. The data has a column for issues; however, we found a problem in this specific case.
Issue tag is irrelevant for this country
Of all the countries, PA is the one that does not have any issue tag.
Recommendation: See why this country does not have any issue tag.
| CL | CO | MX | PA | PE | VE | |
|---|---|---|---|---|---|---|
| Nulls | 30 | 353 | 68 | 63 | ||
| Reasons | 10 | 1,806 | 2,704 | 821 | 350 |
Using Comments as a guide
Another way to understand why there is an increase in detractors is to look at the comments.
We took each comment divided into words and assigned a neutral, negative, and positive label. We removed the neutral label and graph the words. Blue means positive and red means negative.

We see that most of the positive comments come from service, while most of the complains come from delivery, time, damage.
We have now a place to start.
Final Recommendations
1) Find why PA is the only country without issues tag.
2) There is an issue with deliveries. Find why this specific delivery type is failing.